Desktop Application
The EFES-NG Prototype includes an Electron-based desktop application for managing and previewing projects without the command line.
Download the latest version of the EFES-NG Prototype desktop application from here by expanding Assets and choosing the installer for your operating system (
-setup.exefor Windows,.dmgfor Mac,.AppImageor.debfor Linux). On Mac, pick the…-arm64.dmgfor Apple Silicon (M1, M2, M3, M4, ...) or…-x64.dmgfor Intel Macs (check > About This Mac if unsure). See the GitHub repository'sREADMEfor complete instructions.
Creating a New Project
Click New in the toolbar to open the project creation wizard. Enter a project name, choose your XSLT stylesheets (EpiDoc, SigiDoc, or custom), and select a location. The wizard generates a ready-to-use project with all configuration files.
Opening a Project
Click Open in the toolbar and select your project folder (the one containing pipeline.xml). The app loads the pipeline and displays the node list.
Building & Watching
The toolbar buttons change based on the current state:
| State | Available Actions |
|---|---|
| Ready | Start: runs the pipeline and enters watch mode |
| Building | Cancel: aborts the current build |
| Watching | Stop: stops the file watcher |
Clean removes all generated files and caches (available when not building).
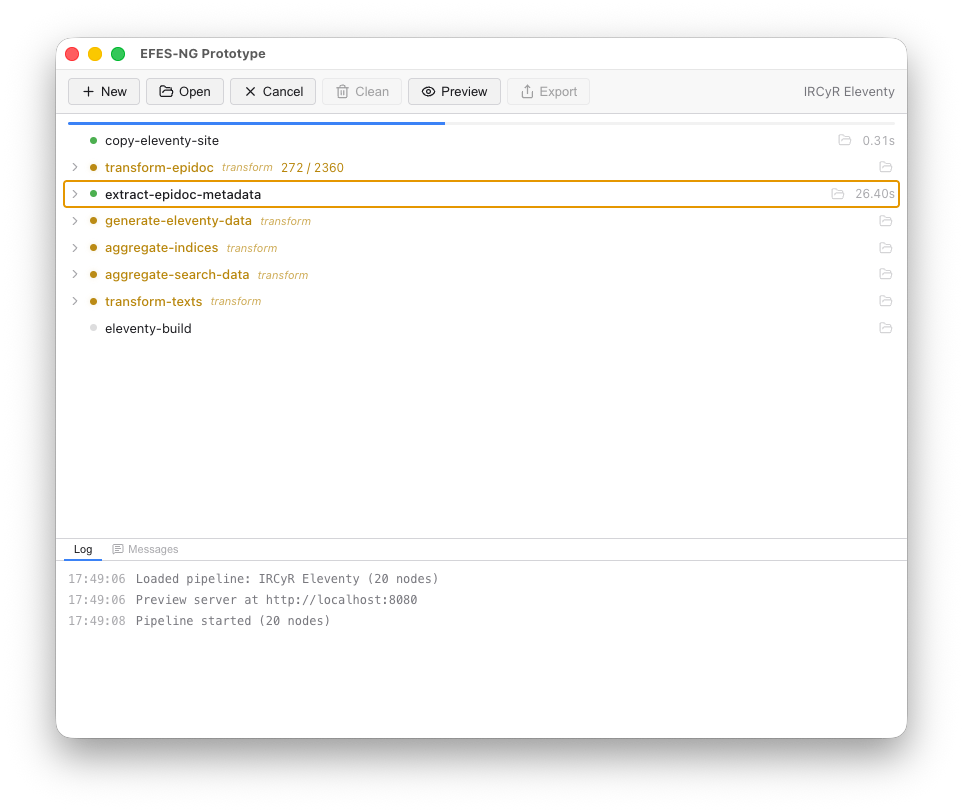
Node List
The left panel shows all pipeline nodes with real-time status:
- Gray dot: pending (not yet started)
- Yellow dot (pulsing): currently running
- Green dot: completed successfully
- Red dot: failed (error message shown inline)
- Dimmed: cached (skipped because inputs haven't changed)
A progress bar at the top shows overall build completion.
Composite Nodes
Nodes that contain sub-steps (like xsltTransform which auto-compiles stylesheets) are shown as collapsible groups. Click the chevron to expand and see individual child nodes. The parent shows a summary. If a child is running, the parent displays which one; if a child errors, the error bubbles up.
Item Progress
Nodes processing multiple files show a counter (e.g., 42 / 128) that updates in real time.
Node Inspector
Click any node to open the inspector panel on the right. It shows:
- Node type: e.g.,
xsltTransform,copyFiles - Cache stats: how many items were cached vs. rebuilt (e.g.,
120/128 cached) - Description: what the node does
- Configuration: all node settings with special rendering for input references (
from,files,dir,collect) - Dependencies: upstream nodes (clickable to navigate)
- Outputs: declared output keys with file lists (expandable)
- Output directory: path to the node's output folder
The inspector panel is resizable by dragging its left edge.
Live Preview
Click Preview to open your site in a browser. The preview includes status overlays:
- "No build output yet": shown when the output directory is empty
- "Building...": blue animated banner during builds
- "Pipeline stopped": amber banner when the watcher is inactive
- Error toast: bottom-right notification with error details
The page automatically reloads after each successful build.
Exporting
Click Export to build your site and save it to a folder for deployment to static hosting. The export dialog lets you choose a destination folder and optionally set a path prefix for subdirectory deployment (e.g., /my-project/).
Log Panel
The bottom panel has two tabs:
- Log: timestamped log messages from the pipeline (node starts, completions, errors, watcher events)
- Messages: user-facing messages from pipeline nodes (e.g.,
xsl:messageoutput from XSLT stylesheets), grouped by node
A badge on the Messages tab shows the count of new messages. Nodes that produced messages also show a badge in the node list; clicking it opens the Messages tab filtered to that node.
Log Files
The application writes log files to the default system location for troubleshooting:
- macOS:
/Users/yourname/Library/Logs/EFES-NG Prototype/ - Windows:
C:\Users\yourname\AppData\Roaming\EFES-NG Prototype\logs\ - Linux:
/home/yourname/.config/EFES-NG Prototype/logs/
Replace yourname with your system username.